You may have noticed the small dots on the left side of each scene title in the scene list.
These dots give you useful information about each scene at a glance. They show whether a scene has a plot assigned and whether the scene has been marked as completed.
Dot States
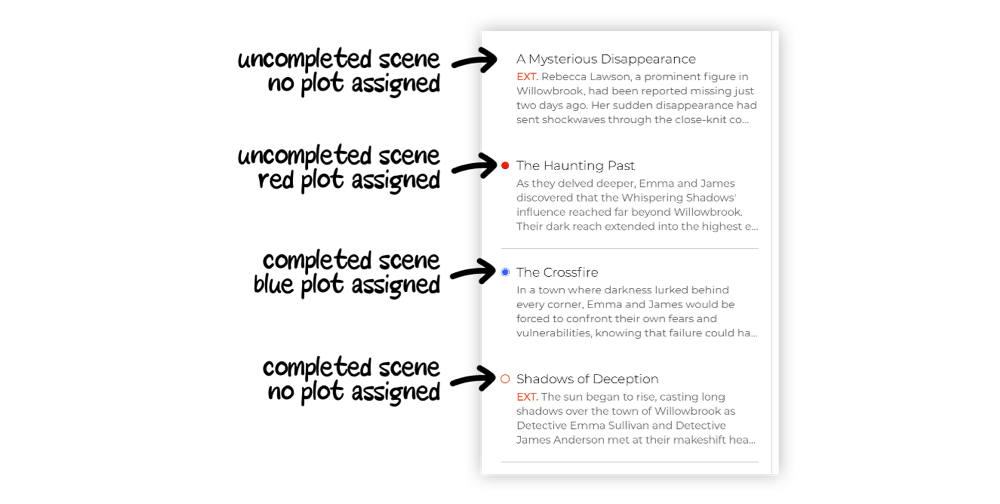
The scene dot can appear in four different states:
- A blank dot means the scene has no plot assigned and has not been completed yet.
- A colored dot means the scene has a plot assigned, but has not been completed yet. The color matches the plot assigned to that scene.
- A circle in the app theme color means the scene has been completed, but has no plot assigned.
- A circle around a colored dot means the scene has been completed and has a plot assigned. The color inside the circle matches the assigned plot.
You can see these states more clearly in the image below:
How to Add a Plot to a Scene
To assign a plot to a scene, open the scene card.
Then tap the central plot field and choose the plot you want to assign to that scene.
Once selected, the scene dot in the list will use the color of the assigned plot.
How to Change the Color of a Plot
Plot colors are managed from the project’s Plots tab.
To change the color of a plot, open the plot card and choose the color you prefer.
Any scene assigned to that plot will show the updated plot color in the scene list.